You shipped a chat product. TTFT is spiking to 800ms at P99 under load. Users notice. You've started to worry that "just add more GPUs" is not a plan.
The real problem is upstream: you don't have a TTFT SLO. Without one, there's no target to size capacity against, no threshold to trigger autoscaling, and no error budget to tell you when you're in trouble. Latency SLOs are a provisioning problem before they are an optimization problem.
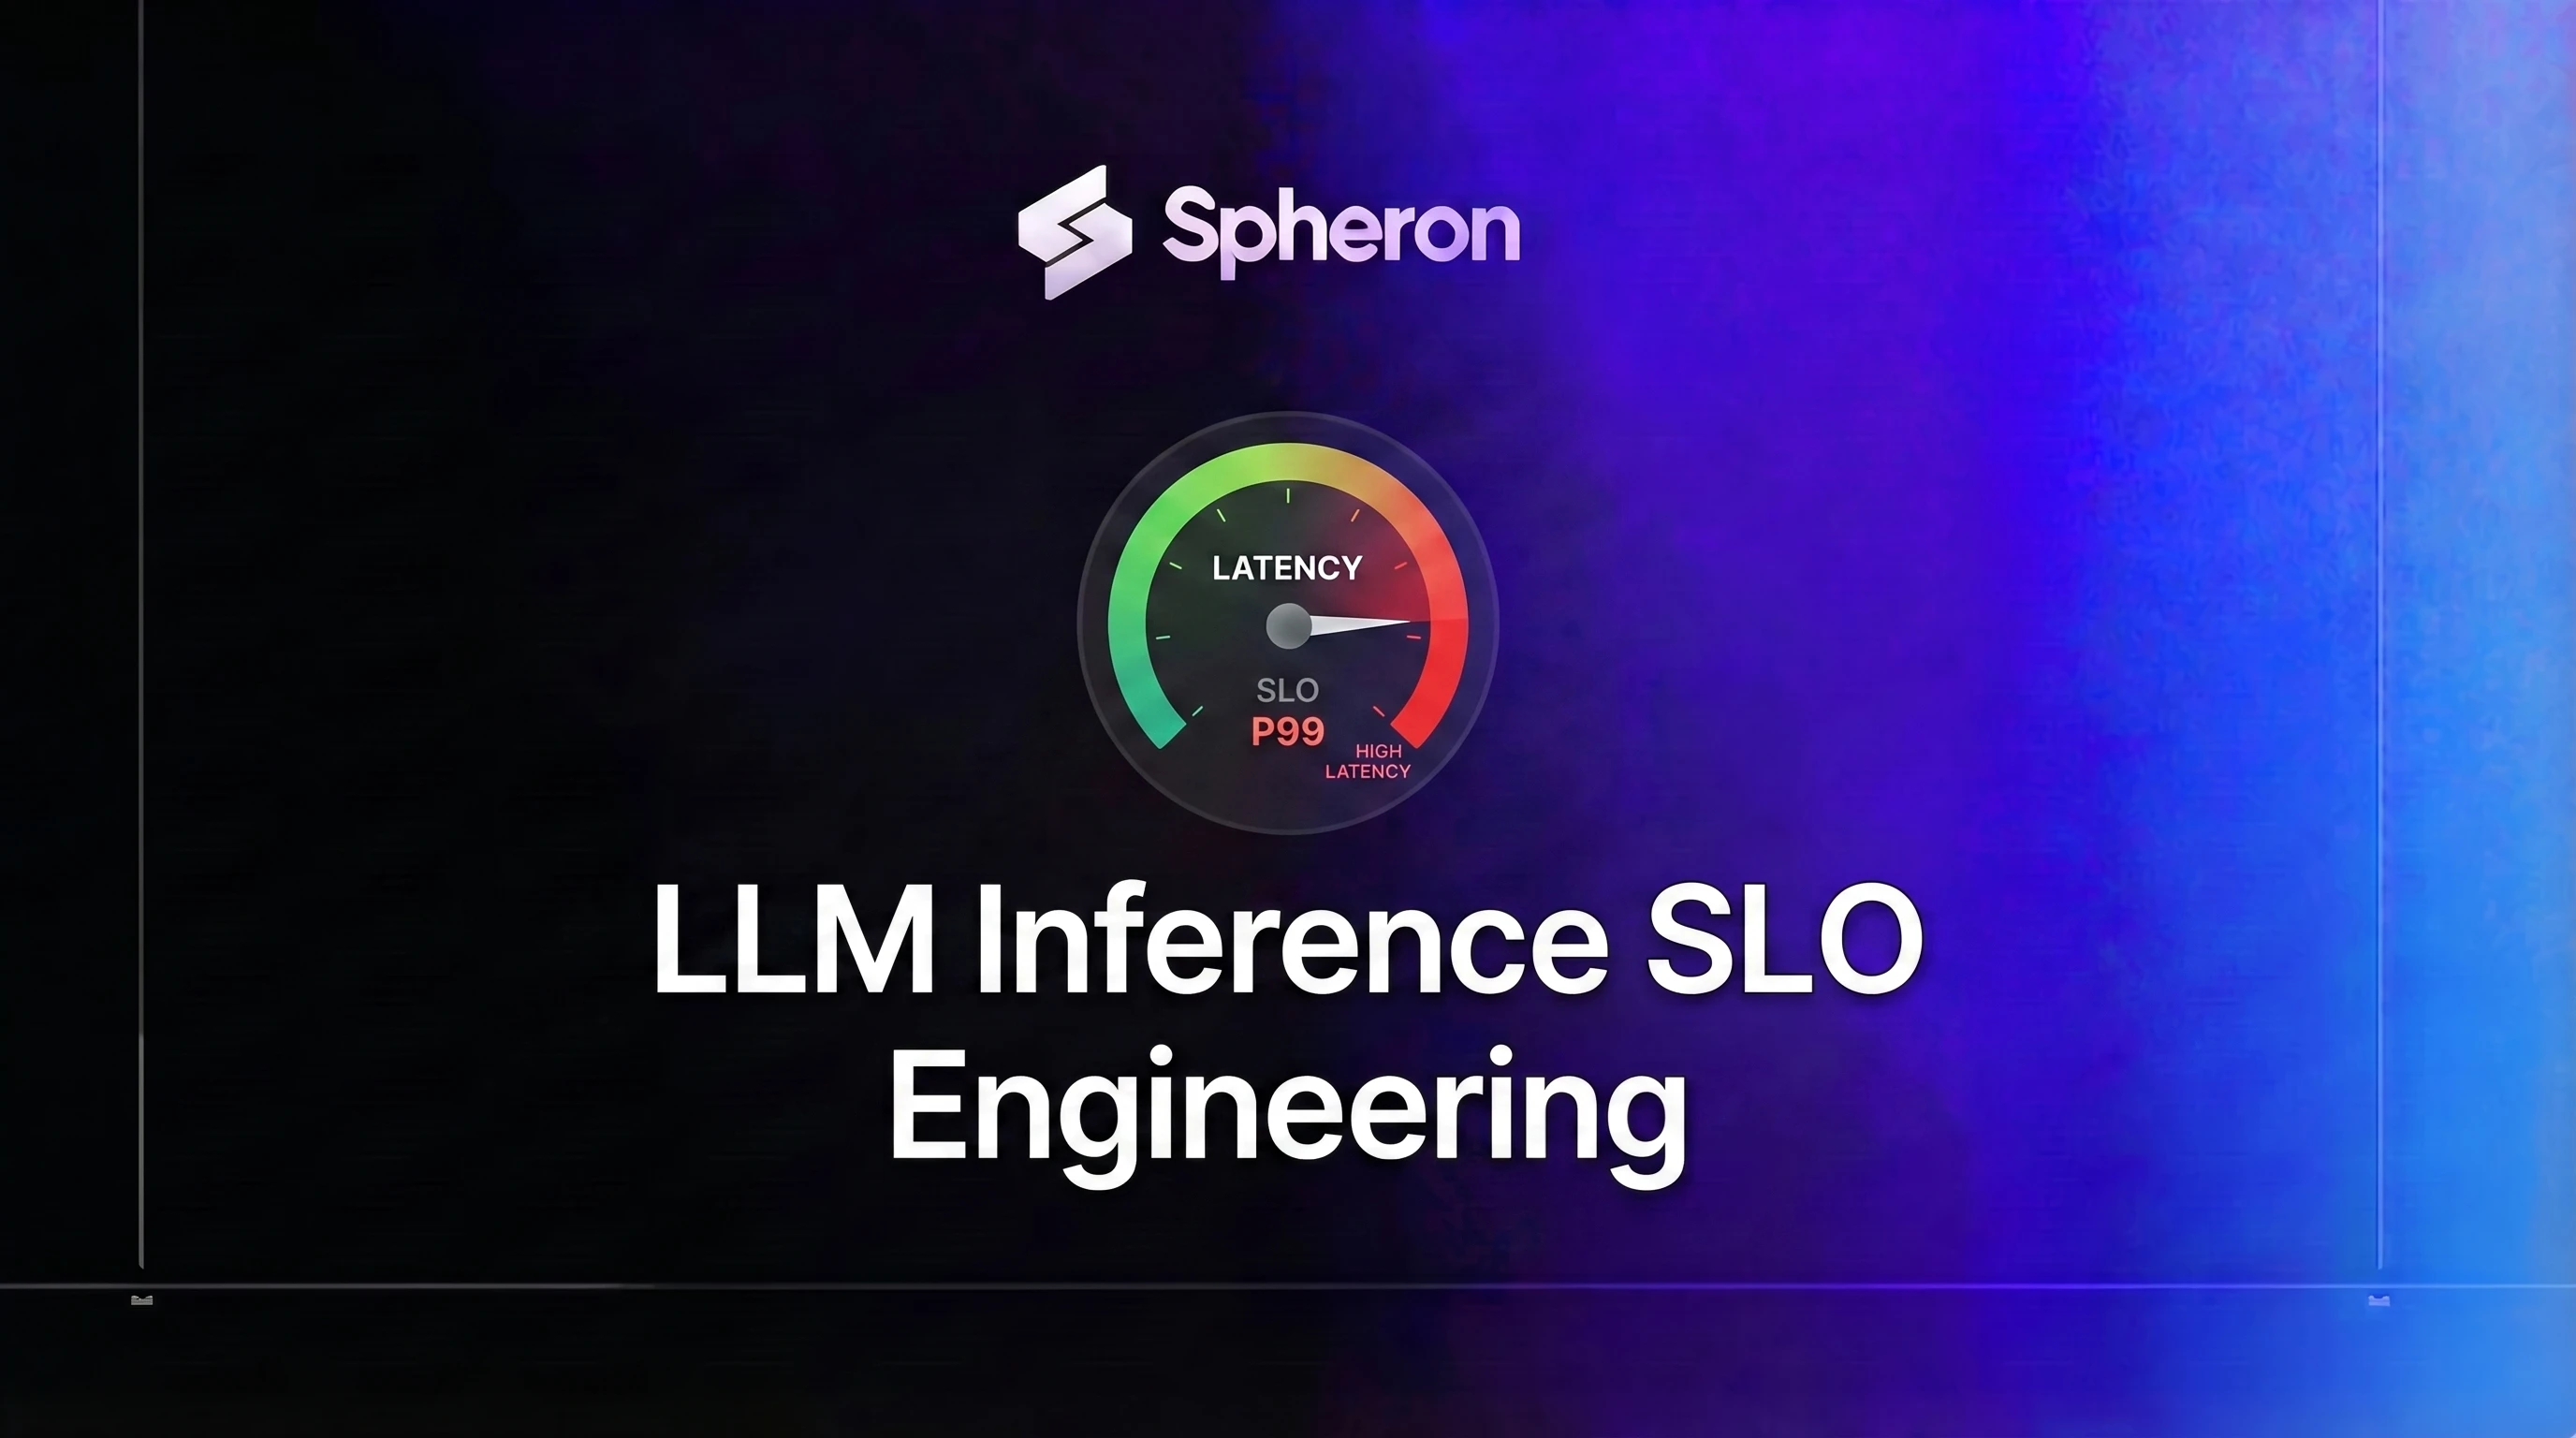
TTFT and ITL: The Only Two Latency Numbers That Define User Experience
Why request latency is the wrong metric for streaming LLM APIs
Total request latency, the wall-clock time from first byte sent to last byte received, is irrelevant for streaming inference. Consider a 500-token response at 40ms ITL: total latency is 20 seconds. That sounds awful. But users are reading the whole time. What actually hurts UX is a slow first token or choppy mid-stream delivery. Total response time only matters for batch jobs that aren't streamed.
TTFT: the cost of prefill
TTFT is the wall-clock time from when a request hits the inference server to when the first output token is sent back to the client. It covers three components:
TTFT = T_net_in + T_queue + T_prefillNetwork ingress (T_net_in) is typically 5-30ms for a regional data center. Queue wait (T_queue) is how long the request sits before prefill begins. Prefill computation (T_prefill) is the GPU time to process the input prompt. For a standard transformer, attention prefill scales roughly O(n²) with prompt length, which is why long-context requests are disproportionately expensive. At 1M+ token contexts this becomes the dominant latency driver. For teams targeting sub-10s TTFT at 1M tokens, SubQ 1M-Preview benchmarks and TTFT analysis shows how linear prefill scaling changes the SLO budget.
ITL: the cost of decode
ITL is the per-token interval during the streaming decode phase, measured as the gap between consecutive token deliveries at the client. For autoregressive decoding, ITL is bounded below by the time to run one forward pass over the KV cache. It is memory-bandwidth-bound: the GPU must read the entire KV cache for every token generated. For a deeper treatment of the memory bandwidth ceiling on decode, see the AI memory wall and inference latency guide.
The practical difference: TTFT feels like lag before the response starts. ITL feels like choppy text flow during the response. Both degrade UX, but through different mechanisms.
How User Perception Makes P99 the Target Metric, Not Average
Why averages hide latency problems
At 100 RPS, average TTFT might look fine at 120ms. But P99 at 600ms means one user per second is waiting half a second before seeing any output. These are the users who refresh the page, report bugs, or churn. P99 is the metric that catches batch interference spikes, KV cache evictions, and GC pauses that disappear when averaged.
There's also a floor effect: the median is bounded below by prefill time, but the tail is unbounded. A single long-prompt request that hits the queue during a burst can push P99 to 3-4x the median. Watching the average gives you no warning.
What streaming does to perceived latency
User perception for streaming responses is driven by two separate signals. TTFT sets the first impression: how long before text starts appearing. ITL variance sets the reading experience: whether the text flows smoothly or arrives in irregular bursts.
A 600ms TTFT followed by smooth 20ms ITL feels noticeably worse than a 200ms TTFT with consistent 25ms ITL. But a 200ms TTFT with ITL jitter spiking to 200ms every 10 tokens causes visible stuttering. Both TTFT and ITL need P99 targets, not just averages.
SLO Targets by Use Case
Start here when setting your first SLO. These targets come from what users can perceive, not from what's technically achievable.
| Use Case | TTFT P99 Target | ITL P99 Target | Notes |
|---|---|---|---|
| Interactive chat | 300ms | 50ms | Users begin reading at first token |
| Voice agent | 150ms | 30ms | TTS pipeline adds 100-200ms; total budget is tight |
| Code completion (inline) | 100ms | 25ms | Sub-100ms to feel "inline"; IDE UX |
| Code completion (panel) | 300ms | 50ms | Slightly relaxed for longer completions |
| RAG-augmented chat | 400ms | 80ms | Retrieval adds latency before prefill begins |
| Batch agent (async) | 3,000ms | 200ms | SLO on total job time, not per-token |
Chat
Chat is the baseline case. 300ms TTFT P99 is where users stop noticing a delay before text begins. At 500ms, most users perceive lag. At 800ms, session abandonment rates measurably increase. The 50ms ITL P99 target gives text flow that reads as near-continuous.
One factor teams overlook: ITL budget tightens as output length grows. A 30-token response with 50ms ITL feels fine. A 2,000-token response with occasional 50ms ITL spikes causes visible stuttering. For long responses, target ITL P99 under 30ms.
Voice agents
Voice has the tightest TTFT budget because the TTS pipeline adds 100-200ms after the LLM finishes generating the first sentence. End-to-end to speech, your total budget might be 400ms. That leaves 150ms for TTFT and 50ms for TTS startup. Any queue buildup that pushes TTFT to 250ms makes the voice agent feel robotic.
For voice latency architecture, the voice AI GPU infrastructure guide and WebRTC streaming voice agent guide cover the full stack.
Code completion
Inline completion (where text appears in the editor as the user types) needs sub-100ms TTFT to feel like a local process. The IDE integration usually handles up to 80ms of debounce, leaving your server 20ms of budget for network plus queue plus prefill. That's only achievable on fast hardware with very short prompts. Panel completions (shown in a sidebar) are relaxed to 300ms because the user has clicked a button and expects a brief wait.
Batch workloads
Batch inference for document summarization, classification, or embedding generation doesn't need per-token SLOs. You're trading latency for throughput. Set an SLO on total job completion time (e.g., 95% of 10k-document batches complete within 4 hours) and size capacity around that, not TTFT.
Decomposing the Latency Budget
Once you have a TTFT P99 target, break it down into per-component budgets. Every millisecond must be accounted for. Here's a worked decomposition for a 400ms TTFT P99 target:
| Component | Budget Allocation | Notes |
|---|---|---|
| Network (ingress) | 20ms | Regional edge to data center |
| Request queue | 50ms | P99 queue wait under target load |
| Prefill computation | 280ms | GPU time for prompt processing |
| Tokenization overhead | 10ms | CPU-bound, often overlooked |
| Gateway/proxy overhead | 15ms | TLS, routing, auth middleware |
| Safety filter (optional) | 25ms | If running inline content moderation |
The total is 400ms. The key numbers to tune are queue (50ms) and prefill (280ms), because those are what you control through capacity planning and serving configuration.
Network ingress
Regional network latency is fixed by geography. Measure it for your production users, don't guess. A CDN edge in the right region can cut this to 5-15ms for most users. The P99 latency matters here too: a noisy-neighbor NIC or overloaded load balancer can push the 99th percentile 3-4x above the median.
Request queue
Queue wait is determined by arrival rate, service rate, and utilization. At 70% utilization with Poisson arrivals, P99 queue wait is approximately 3x the average wait. Size capacity so that peak-load utilization stays at or below 70% for your TTFT target. The capacity planning section below covers the math.
Prefill computation
Prefill is the expensive part. On a 70B FP8 model with 512-token prompts, a single forward pass takes approximately 40ms on an H100 SXM5 at typical serving utilization (around 50% model FLOP utilization for prefill). With chunked prefill enabled, the work is broken into smaller chunks that interleave with ongoing decode, reducing the per-request prefill latency spike. For a thorough treatment of when chunked prefill helps and when to disaggregate, see the prefill-decode disaggregation guide.
Tokenization overhead
Tokenization runs on CPU. On a heavily loaded server, it can take 8-15ms for a 1,024-token prompt. Batch tokenization or pre-tokenization on the client side eliminates this from the server-side budget entirely.
Gateway and proxy overhead
TLS termination, auth middleware, routing, and request logging can add 10-25ms before the request reaches vLLM. Profile your gateway stack once and measure it at P99, not just the mean.
Error Budgets for LLM Inference
Defining "degraded" vs "failed" for LLM responses
LLM responses have a degradation spectrum. A TTFT breach is different from a timeout; a streaming interruption is different from an HTTP 500. For SLO purposes, define breach types explicitly:
- TTFT breach: TTFT P99 exceeds the SLO threshold in a rolling window
- ITL jitter breach: ITL P99 exceeds its threshold, causing visible stuttering
- Incomplete response: the model stopped before completing due to token budget or timeout
- Hard timeout: the request was dropped or returned an error after a timeout
- Error: 5xx response from the inference server
Track each category separately. A 0.5% TTFT breach rate and a 0.1% hard timeout rate call for different responses.
Burn rate math
Apply the SRE burn rate model to your TTFT SLO. If the target is 99.5% of requests complete within 300ms TTFT:
- Error budget per week = 0.5% of total requests
- 1x burn rate = consuming the budget at exactly the sustainable pace
- 14.4x burn rate = consuming the weekly budget in under 12 hours
The burn rate alert threshold that matters for on-call is 14.4x over 1 hour. Here's the Prometheus alert expression:
- alert: TTFTBudgetBurning
  expr: |
    (
      sum(rate(vllm:time_to_first_token_seconds_bucket{le="0.3"}[1h]))
      /
      sum(rate(vllm:time_to_first_token_seconds_count[1h]))
    ) < (1 - 14.4 * 0.005)
  for: 2m
  labels:
    severity: page
  annotations:
    summary: "TTFT SLO burning >14.4x, on-call required"
When degraded responses are acceptable
Batch workloads, non-real-time agents, and background processing jobs can tolerate occasional TTFT breaches without user impact. Define separate SLO tiers: one for interactive endpoints (chat, voice, inline completion) and one for async workloads. Use separate Prometheus alert groups for each tier so on-call pages are scoped to actual user impact.
Workload Shape and Its Impact on P99
Prompt length distribution
Prompt length is the single biggest lever on TTFT. A 4,096-token prompt can inflate prefill time by 4-6x compared to a 256-token prompt on the same hardware. This is not linear, it is quadratic for full attention (O(n²)) and linear for chunked prefill or linear attention variants.
Don't size capacity against the median prompt length. Measure the P99 prompt length in production and size the prefill budget around that. If P99 prompt length is 2,048 tokens, your 280ms prefill budget gets consumed at roughly 2.5x the rate of a 512-token workload.
For techniques to reduce effective prompt length and prefill cost, the KV cache optimization guide covers prefix caching, quantization, and context compression.
Output length distribution and ITL
Longer outputs mean more decode steps and more time occupying a KV cache slot. With continuous batching, a long-running decode request competes for memory and compute with new requests entering the batch. For ITL SLOs, measure P99 output length in production and validate that ITL stays within budget at that output length with your target batch size.
If P99 output length is 512 tokens and you're targeting 40ms ITL P99, validate that your H100 can sustain 40ms per-token decode with a full KV cache at P99 output length. Benchmark this directly, don't infer from throughput numbers.
Batch interference at P99
The P99 TTFT spike usually comes from a long-prompt request hitting the queue at the same time as multiple concurrent short requests. The long request monopolizes prefill capacity for 200-400ms while short requests queue behind it.
This is why 80% GPU utilization is not the right scaling trigger. At 80% utilization with continuous batching, P99 TTFT can already be 2-3x the median. Scale earlier.
Here's what batch interference looks like empirically for a 70B FP8 model on H100 SXM5 with 512-token prompts:
| Concurrent Requests | P50 TTFT | P99 TTFT | P99 / P50 Ratio |
|---|---|---|---|
| 8 | 45ms | 90ms | 2.0x |
| 16 | 52ms | 160ms | 3.1x |
| 32 | 68ms | 280ms | 4.1x |
| 64 | 95ms | 480ms | 5.1x |
At 32 concurrent requests, the 400ms TTFT P99 target is right at the edge. At 64, it's blown. The implication: scale when concurrent request count hits 24-28, not when the GPU hits 80% utilization.
Capacity Planning Math: Provisioned Throughput vs SLO Compliance
Little's Law applied to LLM queues
Little's Law: L = λW, where L is mean number of requests in the system, λ is arrival rate (RPS), and W is mean time in the system (service time). For our TTFT budget model:
- λ = 1,000 RPS (target load)
- W = 40ms average prefill time (per request on H100 SXM5 for 512-token prompts, 70B FP8)
- L = 1,000 × 0.040 = 40 requests in flight at any time
For a P99 queue wait budget of 50ms, you need the queue to stay short. Queue wait scales as ρ / (μ(1-ρ)) where ρ is utilization and μ is service rate. At 70% utilization, mean queue wait is roughly 2.3× the average service time. For a 40ms average service time, that's 92ms mean queue wait, with P99 well above that.
The fix is more capacity. Size so that peak load drives at most 60-70% utilization, depending on how tight your TTFT target is.
The 70% utilization ceiling for P99 targets
Queuing theory (M/M/1 and M/G/1 models) shows that P99 latency grows roughly as 1/(1-ρ) where ρ is utilization. At ρ = 0.8, tail latency is 5x higher than at ρ = 0.2. The practical rule:
- 300ms TTFT P99 target: keep peak utilization at or below 63%
- 400ms TTFT P99 target: keep peak utilization at or below 70%
- 500ms TTFT P99 target: keep peak utilization at or below 75%
Instance count formula
A practical capacity formula for prefill-bound workloads:
instances_needed = ceil(
  peak_RPS / (target_GPU_util / avg_service_time_sec)
)
For our 1,000 RPS example with 40ms average service time and 70% utilization target:
service_rate_per_instance = 0.70 / 0.040 = 17.5 RPS per H100
instances_needed = ceil(1000 / 17.5) = ceil(57.1) = 58 instances
Round up to 60 for headroom. That's the minimum fleet size to hit the 400ms TTFT P99 target at 1,000 RPS with Llama 3.1 70B FP8 on H100 SXM5.
Autoscaling Triggers Tied to SLO Burn Rate
Why GPU utilization is a lagging signal
By the time GPU utilization reaches 85%, the request queue has been building for 30-60 seconds. TTFT P99 has been breaching the SLO budget for that entire window. Scaling on GPU utilization means scaling after the SLO is already failing.
The right trigger is TTFT P99 itself, or better, the burn rate. If the 5-minute TTFT P99 exceeds 300ms and the burn rate is above 5x, new instances need to come up now, not after another two polling intervals.
Prometheus alert rules for TTFT-driven scaling
Here are two alert rules that give you early warning before the SLO burns:
groups:
  - name: ttft_slo
    rules:
      - alert: TTFTBudgetBurning
        expr: |
          (
            sum(rate(vllm:time_to_first_token_seconds_bucket{le="0.3"}[1h]))
            /
            sum(rate(vllm:time_to_first_token_seconds_count[1h]))
          ) < (1 - 14.4 * 0.005)
        for: 2m
        labels:
          severity: page
        annotations:
          summary: "TTFT SLO burning at >14.4x rate - page on-call"

      - alert: TTFTQueueDepthWarning
        expr: sum(vllm:num_requests_waiting) > 24
        for: 30s
        labels:
          severity: warning
        annotations:
          summary: "Request queue above 24 - TTFT P99 degradation likely within 60s"
The queue depth threshold (24 in the example) comes from the batch interference table above: at 32 concurrent requests the TTFT P99 hits the ceiling. Set it to ~75% of the concurrency limit where degradation starts.
KEDA configuration for latency-based scaling
Use KEDA with a Prometheus trigger on TTFT P99 rather than GPU utilization. The ScaledObject targets the TTFT metric directly:
apiVersion: keda.sh/v1alpha1
kind: ScaledObject
metadata:
  name: vllm-ttft-scaler
spec:
  scaleTargetRef:
    name: vllm-deployment
  minReplicaCount: 2
  maxReplicaCount: 80
  pollingInterval: 15
  cooldownPeriod: 120
  advanced:
    horizontalPodAutoscalerConfig:
      behavior:
        scaleUp:
          stabilizationWindowSeconds: 30
        scaleDown:
          stabilizationWindowSeconds: 120
  triggers:
    - type: prometheus
      metadata:
        serverAddress: http://prometheus:9090
        metricName: vllm_ttft_p99
        threshold: "0.3"
        query: |
          histogram_quantile(0.99,
            sum(rate(vllm:time_to_first_token_seconds_bucket[5m])) by (le)
          )
For the full KEDA deployment walkthrough including cold-start optimization and Knative scale-to-zero, see the KEDA and Knative GPU autoscaling guide.
Load Shedding, Request Prioritization, and Graceful Degradation
Request queue prioritization
Not all requests carry the same latency requirement. A two-tier priority queue separates interactive requests (chat, voice, inline completion) from batch/agent requests (document processing, background evaluation). Under load, the batch queue sheds first.
In vLLM, use --max-num-seqs to cap total concurrent sequences, then route interactive requests to a priority lane with a dedicated vLLM instance or via a LiteLLM router with weighted priority. The interactive instance reserves capacity for requests that directly impact user experience.
Dynamic context length reduction
Under TTFT pressure, reduce max_tokens or truncate input prompts to keep responses within budget. For RAG workloads, this means falling back from a 10-chunk retrieval to a 3-chunk retrieval when queue depth exceeds a threshold. For summarization, it means generating a shorter summary rather than queuing. Both degrade quality, but they preserve the user session.
Implement the reduction logic in your API gateway as a function of current TTFT P99: when P99 exceeds 200% of the SLO target for more than 10 seconds, activate context reduction mode.
Circuit breakers
When TTFT P99 consistently exceeds 2x the SLO target for more than 30 seconds, reject new requests with HTTP 429 rather than continuing to queue them. Each queued request makes the problem worse by adding to the backlog that already-degraded in-flight requests are competing with. Return a Retry-After: 5 header so clients back off predictably.
This protects in-flight requests at the cost of rejecting new ones. For interactive chat, a 429 with a retry is better UX than a 2-second TTFT.
Observability Stack for SLO Monitoring
vLLM Prometheus metrics
vLLM (v0.4+) exposes these metrics at /metrics. All histogram metrics use _bucket, _count, and _sum suffixes in Prometheus convention.
| Metric | Type | SLO Use |
|---|---|---|
vllm:time_to_first_token_seconds | Histogram | Primary TTFT SLO metric |
vllm:inter_token_latency_seconds | Histogram | ITL SLO metric |
vllm:num_requests_waiting | Gauge | Queue depth signal |
vllm:num_requests_running | Gauge | Active batch size |
vllm:gpu_cache_usage_perc | Gauge | KV cache pressure |
vllm:request_success_total | Counter | Success rate for error budget |
To add a Prometheus scrape job:
scrape_configs:
  - job_name: 'vllm'
    static_configs:
      - targets: ['vllm-service:8000']
    scrape_interval: 10s
    metrics_path: /metrics
Grafana dashboard panels
Four panels cover the SLO dashboard:
- TTFT P50/P95/P99 time series (1h rolling window):
histogram_quantile(0.99, sum(rate(vllm:time_to_first_token_seconds_bucket[5m])) by (le)). Add a horizontal reference line at your SLO threshold.
- ITL P99 time series:
histogram_quantile(0.99, sum(rate(vllm:inter_token_latency_seconds_bucket[5m])) by (le)). Add the SLO threshold line.
- Error budget burn rate gauge: compute the ratio of SLO-compliant requests to total requests over a 1h window, then show remaining budget as a percentage.
- Queue depth heatmap:
vllm:num_requests_waitingandvllm:num_requests_runningon the same panel to show batch pressure over time.
Langfuse for application-layer latency
Prometheus covers inference server latency. Langfuse (or Arize Phoenix) traces end-to-end latency from the application layer, including RAG retrieval, prompt construction, and streaming delivery to the client. The gap between Langfuse trace duration and vLLM TTFT shows you where non-inference latency is hiding. For the full observability stack, see the LLM observability guide.
Worked Example: Sizing a Spheron Deployment to Hit 400ms TTFT P99 at 1,000 RPS
Problem definition
- Model: Llama 3.1 70B FP8
- Target: TTFT P99 400ms, ITL P99 50ms
- Load: 1,000 RPS peak, P99 prompt length 512 tokens, P99 output 256 tokens
- Framework: vLLM with chunked prefill enabled
Prefill cost estimation
A 70B FP8 model requires 70GB of VRAM for weights (1 byte per parameter). An H100 SXM5 has 80GB HBM3, fitting the model with 10GB for KV cache.
The FLOP count for a 512-token prefill on a 70B dense transformer:
FLOPs = 2 × num_params × seq_len
      = 2 × 70×10⁹ × 512
      = 71.7 TFLOPs
H100 SXM5 peaks at 3,958 TFLOPS for FP8 tensor core operations. At 50% model FLOP utilization (typical for vLLM prefill with memory bandwidth and scheduling overhead):
prefill_time = 71.7 TFLOPs / (3,958 TFLOPS × 0.50)
             = 71.7 / 1,979
             ≈ 36ms
Round up to 40ms for tokenization, KV cache writes, and scheduling overhead. This is the average prefill time per request at the target operating point.
Instance count calculation
Using the capacity formula from above:
service_rate_per_instance = 0.70 / 0.040s = 17.5 RPS per H100
instances_needed = ceil(1,000 / 17.5) = ceil(57.1) = 58 → 60 instances
With 60 H100 SXM5 instances running Llama 3.1 70B FP8 on H100 on Spheron, peak utilization at 1,000 RPS stays at ~68%, leaving headroom for burst.
For H200 SXM5: the 141GB HBM3e supports much larger KV cache per instance, enabling batch sizes of 48-64 concurrent sequences vs 16-24 on H100. At the same TTFT target, an H200 handles approximately 27 RPS per instance. That changes the sizing:
instances_needed = ceil(1,000 / 27) = ceil(37.04) = 38 → 40 instancesRent H200 on Spheron for workloads where larger KV cache headroom reduces the instance count.
Cost table
Live pricing as of 15 May 2026:
| Configuration | Instances | GPU | Spot $/hr | Monthly (spot) |
|---|---|---|---|---|
| 400ms TTFT P99 | 60 | H100 SXM5 | $1.69 | $73,008 |
| 400ms TTFT P99 | 40 | H200 SXM5 | $1.89 | $54,432 |
The H200 fleet costs 25% less at spot rates despite a higher per-instance price. The larger KV cache reduces instance count enough to offset the unit cost difference.
Spheron's per-minute billing means you pay for instances only when they are running. During off-peak hours when RPS drops to 200, scaling down to 14 H100 spot instances cuts the hourly bill from $101.40 to $23.66, with no penalty for rapid scale-down.
Pricing fluctuates based on GPU availability. The prices above are based on 15 May 2026 and may have changed. Check current GPU pricing on Spheron for live rates.
SLO tightness cost comparison
Tighter TTFT targets require lower peak utilization, which means more instances for the same RPS. Here's the cost impact for the same 1,000 RPS workload on H100 SXM5:
| TTFT P99 Target | Max GPU Util | Instances (H100) | Monthly Cost |
|---|---|---|---|
| 200ms | 55% | 73 | $88,826 |
| 300ms | 63% | 64 | $77,875 |
| 400ms | 70% | 60 | $73,008 |
| 500ms | 75% | 54 | $65,707 |
Each tier tighter on TTFT P99 adds meaningful capacity cost. Going from 500ms to 200ms targets increases the infrastructure spend by roughly 35%. This is the cost of the SLO: define it against your actual user experience requirements, not the tightest number that looks impressive in a status doc.
Latency SLOs are a provisioning problem before they are an optimization problem. Running the capacity math before you scale prevents both overprovisioning and SLO breaches. H100 SXM5 and H200 instances on Spheron give you per-minute billing to right-size for your P99 target without locking into reserved capacity.
Rent H100 on Spheron | Rent H200 on Spheron | View current GPU pricing
Quick Setup Guide
vLLM exposes Prometheus metrics at /metrics by default once the API server is running, with no extra flags needed. The histograms vllm:time_to_first_token_seconds and vllm:inter_token_latency_seconds are available automatically. Add a Prometheus scrape job targeting your vLLM endpoint. Verify the histograms populate by running a few test requests and querying histogram_quantile(0.99, rate(vllm:time_to_first_token_seconds_bucket[5m])).
In Grafana, create a panel with the PromQL expression histogram_quantile(0.99, sum(rate(vllm:time_to_first_token_seconds_bucket[5m])) by (le)) and add an alert threshold at your TTFT P99 SLO value in seconds. Configure notification channels for on-call routing. Add a second alert on error budget burn rate: if (1h_burn_rate > 14.4) the budget is exhausting 36x faster than target.
Deploy the Prometheus adapter and create a KEDA ScaledObject with a Prometheus trigger on the TTFT P99 metric. Set the target value to your SLO threshold (e.g. 0.3 for 300ms). Set scaleUp.stabilizationWindowSeconds to 30 and scaleDown.stabilizationWindowSeconds to 120 to prevent scale thrash. This ensures scaling happens before queue depth causes visible latency degradation.
Size your on-demand baseline to handle average RPS at 70% utilization with your SLO met. Use Spheron spot instances for burst capacity above that baseline. In your load balancer or inference router, configure health checks that remove a spot instance within 10 seconds of a preemption signal. Monitor TTFT P99 separately on on-demand vs spot instances to validate the split handles your SLO budget correctly.
Frequently Asked Questions
For chat, aim for a TTFT P99 under 300ms for fluid perceived responsiveness. Users begin reading output within 300ms without noticing a delay. Voice agents require tighter budgets - under 150ms TTFT to avoid perceptible lag in turn-taking. Code completion tools like Copilot target sub-100ms TTFT to feel inline.
vLLM exposes a Prometheus metric vllm:time_to_first_token_seconds as a histogram. Scrape it at /metrics and compute the P99 with histogram_quantile(0.99, rate(vllm:time_to_first_token_seconds_bucket[5m])). This gives you real P99 TTFT across all requests in the scrape window.
TTFT (Time to First Token) measures how long until the first output token arrives at the client - this covers network, queue, and prefill time. TPOT (Time Per Output Token) is the average decode speed across the full response. ITL (Inter-Token Latency) is the per-token gap during decode streaming, which determines how smooth the text stream appears. For SLO engineering, TTFT and ITL P99 are the primary targets; TPOT is a throughput metric.
Larger batches improve GPU utilization and tokens-per-second throughput but increase TTFT and ITL for individual requests. Each request must wait for prefill of all concurrent requests before decode begins. For P99 TTFT targets, batch size is one of the most important tunables - reduce it under high concurrency if TTFT P99 starts breaching budget.
Yes, with the right architecture. The key is to use spot instances for burst capacity and maintain a minimum baseline of on-demand instances sized to handle your P99 SLO under average load. When a spot instance is preempted, requests reroute to the on-demand baseline. This mixed model cuts cost by 40-60% vs pure on-demand while preserving SLO compliance during normal operations.