Running a ReAct loop where every thought-action-observation step calls a 70B frontier model means paying top-tier GPU prices for the simple steps (web search parsing, data extraction, formatting) as well as the hard ones. For a 10-step task, that is 10 full frontier model calls. Plan-and-Execute fixes this at the architecture level: one planning call on a frontier model, then N executor calls routed to a smaller, cheaper model. The principle is the same as the query-complexity routing covered in the LLM inference router guide but applied at the agent stage level rather than individual query level.
When the executor sub-agents are built on a different framework than the planner, or when you want protocol-level interop without custom glue code, the A2A protocol guide covers how Agent Cards and task routing work across frameworks.
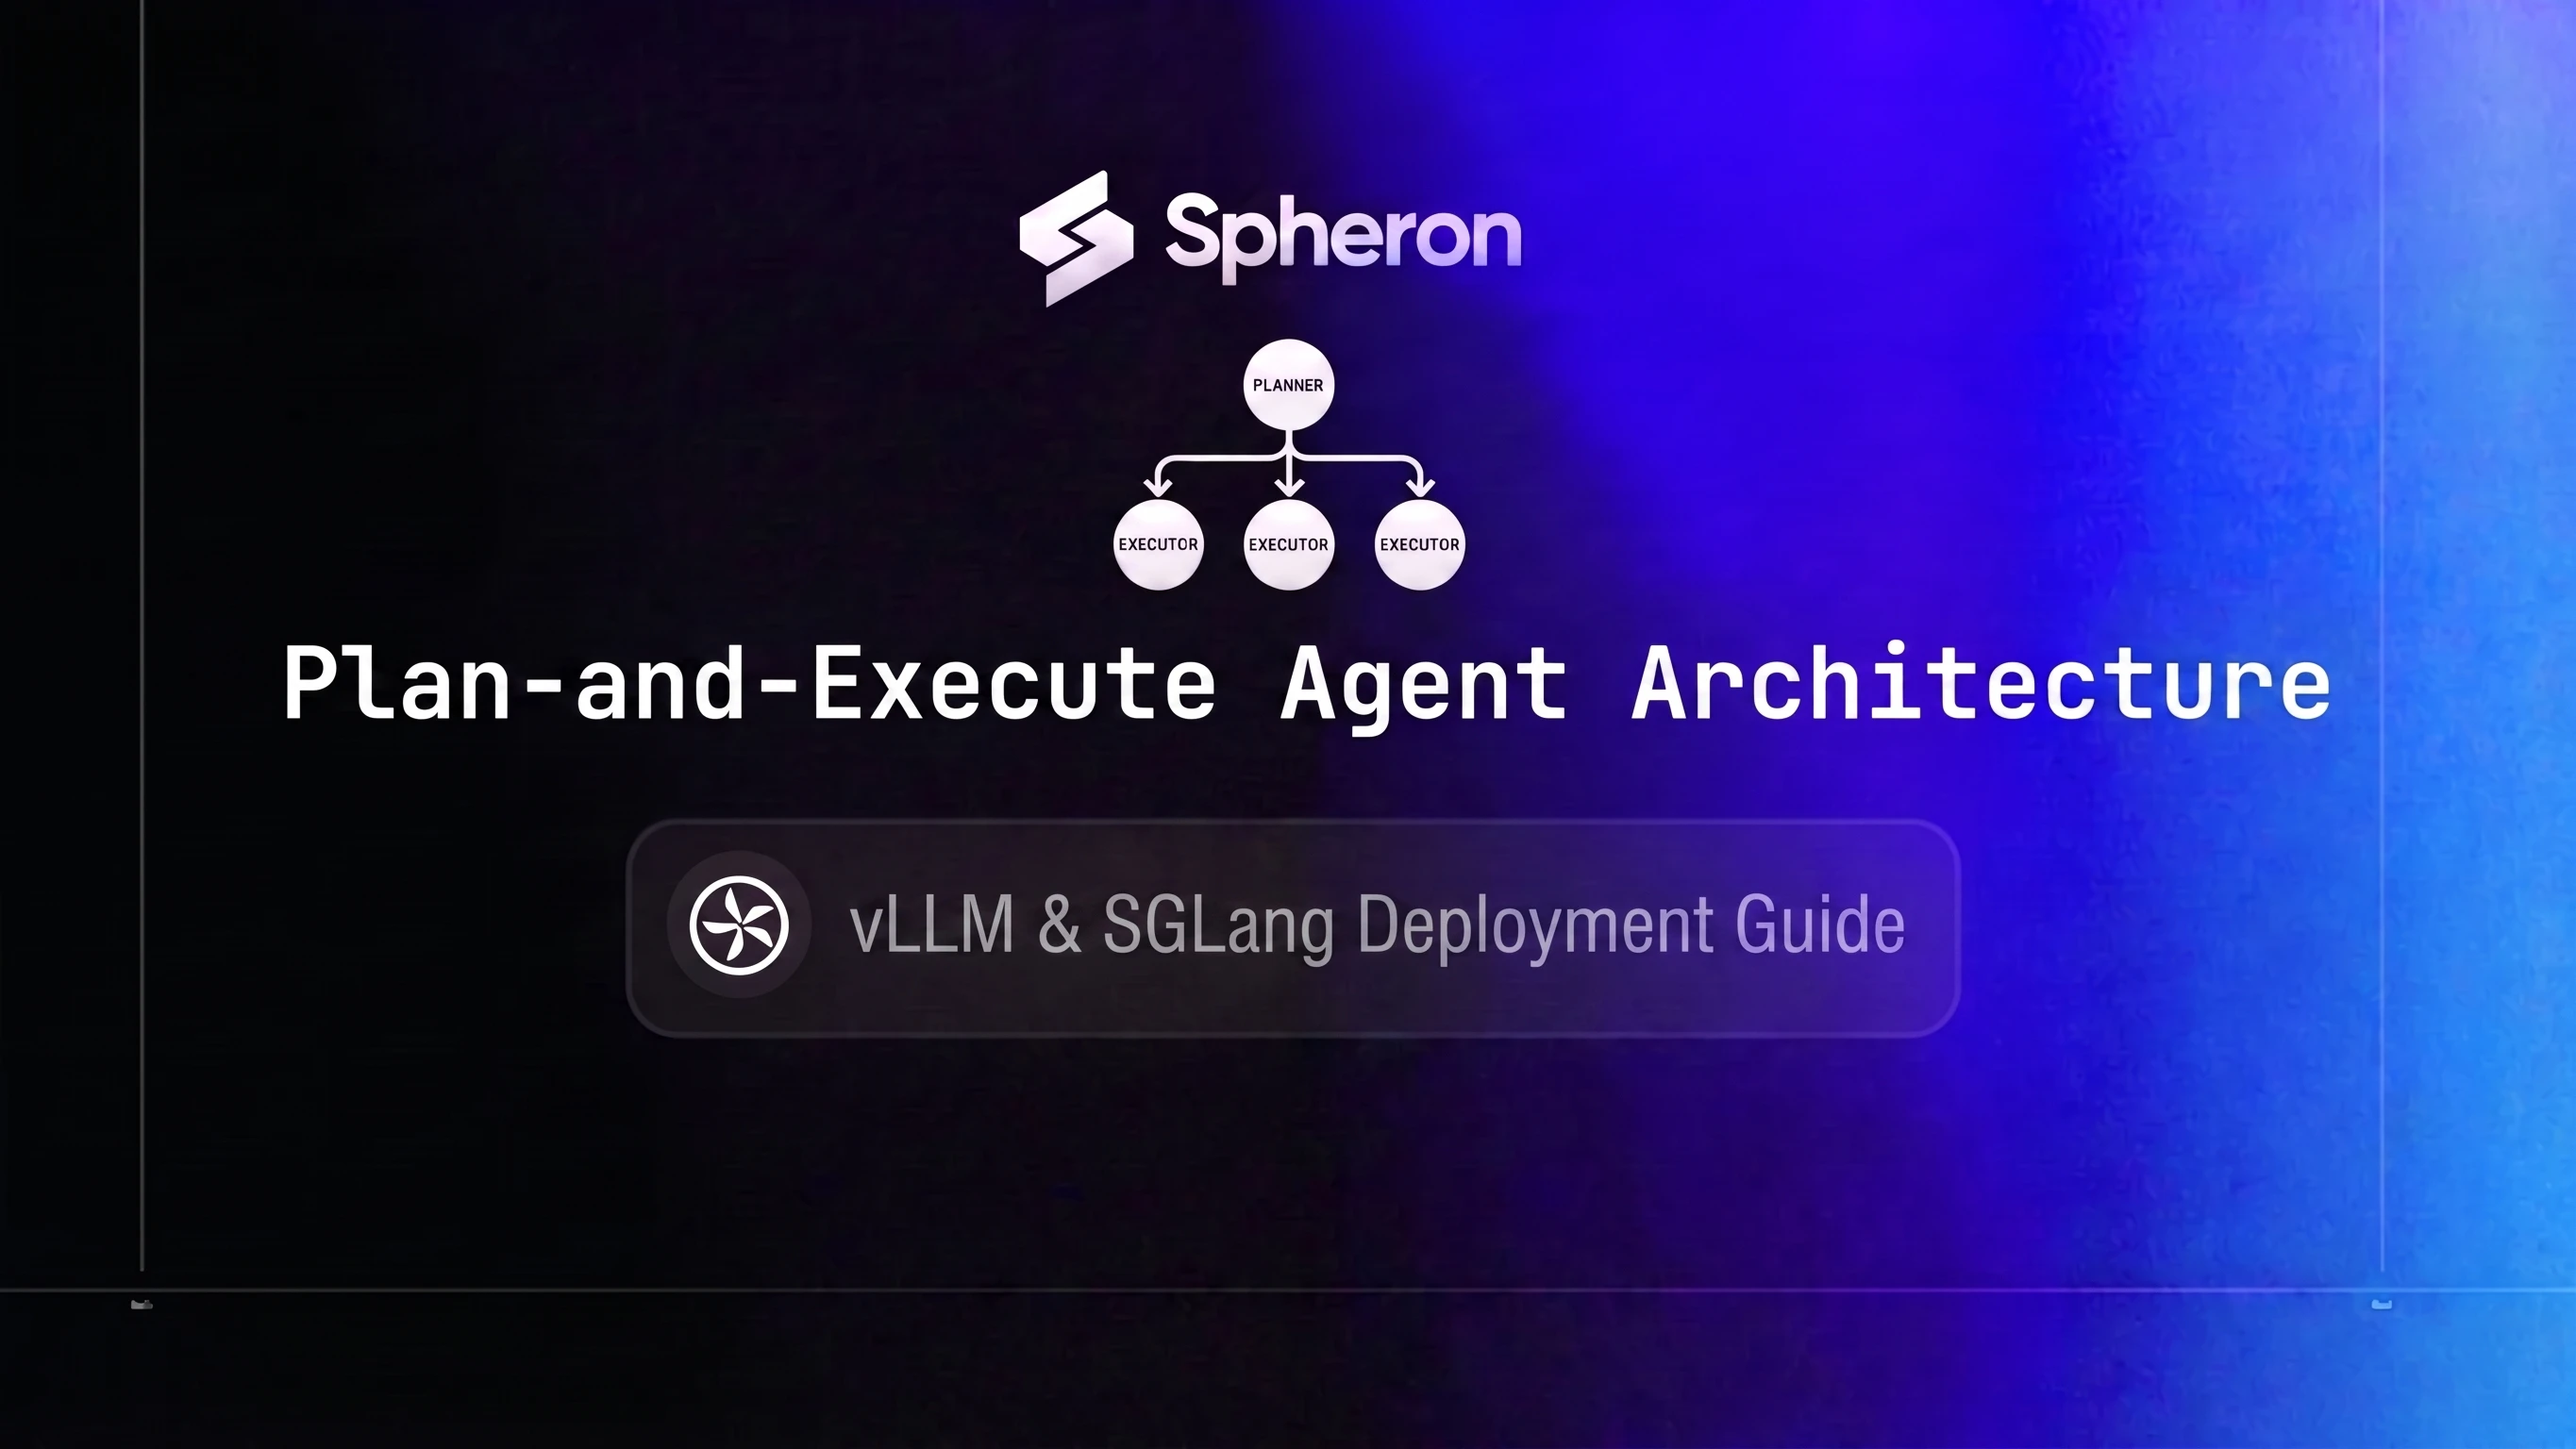
The Plan-and-Execute Pattern Explained
The pattern splits agent work into two distinct stages:
Planner: a frontier LLM (70B+) receives the user task and outputs a structured JSON plan. The plan is a list of sub-tasks, each with a step_id, tool_name, args, and depends_on field. This call happens once per task.
Executor: a small LLM (7B-14B) receives individual sub-tasks from the plan, calls the specified tool, and returns the result. These calls are cheap, isolated, and can run in parallel where the dependency graph allows.
Here is what a planner output looks like:
{
  "task": "Research recent GPU pricing trends and summarize findings",
  "steps": [
    {
      "step_id": 1,
      "tool_name": "web_search",
      "args": {"query": "GPU cloud pricing trends 2026"},
      "depends_on": []
    },
    {
      "step_id": 2,
      "tool_name": "web_search",
      "args": {"query": "H100 H200 price comparison 2026"},
      "depends_on": []
    },
    {
      "step_id": 3,
      "tool_name": "summarize",
      "args": {"text": "{step_1_result}\n{step_2_result}"},
      "depends_on": [1, 2]
    }
  ]
}
Steps 1 and 2 have no dependencies and can run in parallel. Step 3 waits for both. The executor pool handles all three; the planner never sees another token until the next task arrives.
ReAct vs Plan-and-Execute at a glance:
| Property | ReAct Loop | Plan-and-Execute |
|---|---|---|
| Model calls per task | N (one per step) | 1 planner + N executors |
| Model size for all calls | Frontier (70B+) | Frontier for plan only, small (7B) for execution |
| Context growth per step | Grows (full history) | Isolated per sub-task |
| Error cascade | Yes (bad step taints rest) | Partial (failed sub-task is isolated) |
| Parallelism | Sequential by default | Independent steps run concurrently |
Why ReAct Loops Are Expensive at Scale
In a ReAct loop, each step appends the previous observation to the context. By step 8, the model is re-reading 6,000+ tokens of history before generating the next action. That context growth has two costs: more tokens billed and slower time-to-first-token as KV cache fills. This is the same re-sent-context mechanism behind why agentic AI inference cost runs 5-30x higher than a single chat turn; ReAct loops are the worst-case version of it because every step pays for the full history again.
For a 10-step research-and-write task, the token math looks like this:
ReAct loop:
- 10 frontier model calls at an average of 1,500 tokens each
- Total: 15,000 tokens, all billed at frontier model rates
- Context grows with each step, pushing later calls toward 2,000+ tokens
Plan-and-Execute:
- 1 frontier model call for planning: 2,000 tokens
- 9 executor calls at 800 tokens each: 7,200 tokens
- Total: 9,200 tokens, with only 2,000 at frontier model rates
The critical difference is that in Plan-and-Execute, each executor call receives only its isolated sub-task context. There is no history accumulation. For tool-call-heavy tasks, this keeps executor token counts flat regardless of where the task sits in the workflow. See AI inference cost economics for how token count affects latency and total spend at scale.
Token Economics: The 90% Savings Breakdown
The table below uses live GPU pricing fetched from the Spheron API and assumes representative throughput figures: 2,500 tokens/sec for Llama-3.3-70B-Instruct on H200 SXM5 at FP8, and 6,000 tokens/sec for Qwen2.5-7B-Instruct on L40S at FP8.
Derived cost per million tokens:
- H200 SXM5 at $4.54/hr: $4.54 / (2,500 × 3,600) × 1,000,000 = $0.504/1M tokens
- L40S at $0.96/hr: $0.96 / (6,000 × 3,600) × 1,000,000 = $0.044/1M tokens
The L40S is roughly 11x cheaper per token than the H200 for these model sizes.
Cost comparison for a 10-step task:
| Architecture | Token distribution | Token cost | Cost/task | Cost/1,000 tasks |
|---|---|---|---|---|
| ReAct (all on H200 SXM5) | 15,000 tokens at $0.504/1M | $4.54/hr compute | $0.00756 | $7.56 |
| Plan-and-Execute (H200 planner + L40S executors) | 2,000 on H200 + 7,200 on L40S | Mixed rate | $0.00133 | $1.33 |
Savings: 82% for this 10-step example.
The percentage rises with more executor steps. For tasks with 8+ sub-tasks where the planning call stays compact, the planner-to-executor token ratio pushes savings into the 85-92% range. The exact figure depends on your average sub-task length and how much context your executor prompts carry. The 90% headline is achievable for workflows with a high volume of short, tool-call-heavy executor steps.
Pricing fluctuates based on GPU availability. The prices above are based on 08 Jun 2026 and may have changed. Check current GPU pricing → for live rates.
Reference Architecture: Planner Pool + Executor Pool
User Task
     |
     v
[Orchestrator API - FastAPI]
     |
     v
[Planner Pool - vLLM on H200 SXM5]
 (frontier model: Llama-3.3-70B-Instruct or Qwen2.5-72B-Instruct)
     |
     v  JSON plan
[Redis Task Queue]
     |
     +-----------+-----------+
     v           v           v
[Executor]  [Executor]  [Executor]
[SGLang     [SGLang     [SGLang
 L40S]       L40S]       L40S]
     |           |           |
     +-----------+-----------+
                 |
                 v
         [Results Aggregator]
                 |
                 v
           Final Response
Each component has a single responsibility:
Orchestrator API: FastAPI service that receives the user task, calls the planner, fans out sub-tasks to the Redis queue, and assembles the final response once all steps complete.
Planner pool: 1-2 H200 SXM5 nodes running vLLM with the frontier model. Handles only planning calls. Size this pool based on your peak concurrent planning load, not executor throughput.
Redis task queue: Holds decomposed sub-tasks between the planner and executor pool. Provides natural backpressure: if executor nodes are busy, tasks queue up without blocking the planner. Track queue depth as your primary autoscaling signal for the executor tier.
Executor pool: 2-8 L40S nodes running SGLang with Qwen2.5-7B or 14B at FP8. Scales independently from the planner pool. Planner saturation and executor saturation have completely different root causes: the planner queue grows when complex tasks spike, the executor queue grows when task volume spikes.
Results aggregator: Collects executor outputs keyed by step_id, resolves dependency ordering, and optionally runs a final synthesis call on the planner pool for tasks that need a polished written output.
For tasks where sub-task models only need a 3B-7B parameter range, NVIDIA MIG on A100 or H100 lets you partition one physical GPU into smaller slices. This reduces idle time on underloaded nodes. See the heterogeneous GPU inference guide for the hardware pairing rationale.
For autoscaling patterns and queue-based trigger configuration across the executor pool, see the scale AI agent fleets guide.
Step-by-Step Deployment
Planner Pool: vLLM on H200 SXM5
Rent an H200 SXM5 on Spheron for the planner tier. The H200 SXM5's 141GB HBM3e and 4.8 TB/s memory bandwidth give you fast TTFT on 70B models, which matters for planning calls where the user is actively waiting.
Deploy vLLM:
vllm serve meta-llama/Llama-3.3-70B-Instruct \
  --dtype fp8 \
  --port 8001 \
  --tool-call-parser llama3_json \
  --max-num-seqs 64 \
  --max-model-len 8192
The --dtype fp8 flag is what gets you to 2,500 tokens/sec on the H200 rather than 1,400 at BF16. The --tool-call-parser llama3_json flag tells vLLM to decode the structured JSON tool calls from the model's native output format. Set --max-num-seqs to match your expected concurrent planning requests. The --max-model-len 8192 keeps KV cache overhead manageable; increase it only if your task descriptions or tool schemas require longer context.
Run the planner pool on H200 on-demand at $4.54/hr. The planner handles one call per task, so it rarely needs more than one or two nodes even under heavy load.
Executor Pool: SGLang on L40S
Rent L40S executor instances for the executor tier. Use spot pricing where available: sub-task retries absorb preemptions, and executor pool spot preemptions only delay one sub-task, not the full task.
Deploy SGLang on each L40S node:
python -m sglang.launch_server \
  --model-path Qwen/Qwen2.5-7B-Instruct \
  --tp 1 \
  --port 8002 \
  --mem-fraction-static 0.85
Each L40S node at this configuration handles 30-50 concurrent sub-task requests. Scale the number of nodes horizontally by watching Redis queue depth. You want queue depth to stay below 20 pending tasks under normal load. Set the minimum floor at one warm node to avoid cold-start delays on the first batch of tasks after an idle period.
If your executor sub-tasks span different complexity tiers, you can split the executor pool: a 7B model pool on L40S for simple tool calls and a 14B model pool for sub-tasks that need more reasoning. The inference router routes executor requests by task type.
Inference Router
The router is a FastAPI proxy with two endpoints:
from fastapi import FastAPI, HTTPException
import asyncio
import httpx
import jsonschema

app = FastAPI()

PLANNER_URL = "http://planner-pool:8001/v1/completions"
EXECUTOR_URL = "http://executor-pool:8002/v1/completions"

SUBTASK_SCHEMA = {
    "type": "object",
    "required": ["step_id", "tool_name", "args", "depends_on"],
    "properties": {
        "step_id": {"type": "integer"},
        "tool_name": {"type": "string"},
        "args": {"type": "object"},
        "depends_on": {"type": "array", "items": {"type": "integer"}}
    }
}

@app.post("/plan")
async def plan(task: dict, request_id: str):
    # Forward to vLLM on H200, no retry
    async with httpx.AsyncClient(timeout=120.0) as client:
        response = await client.post(
            PLANNER_URL,
            json=task,
            headers={"X-Request-ID": request_id}
        )
    response.raise_for_status()
    return response.json()

@app.post("/execute")
async def execute(subtask: dict, request_id: str, step_id: int):
    # Validate schema before consuming GPU time
    try:
        jsonschema.validate(instance=subtask, schema=SUBTASK_SCHEMA)
    except jsonschema.ValidationError as e:
        raise HTTPException(status_code=422, detail=str(e))

    # Retry up to 3x with exponential backoff
    for attempt in range(4):
        try:
            async with httpx.AsyncClient() as client:
                response = await client.post(
                    EXECUTOR_URL,
                    json=subtask,
                    headers={
                        "X-Request-ID": request_id,
                        "X-Step-ID": str(step_id)
                    },
                    timeout=30.0
                )
            response.raise_for_status()
            return response.json()
        except httpx.HTTPStatusError as e:
            if e.response.status_code < 500:
                raise  # client error — don't retry
            if attempt == 3:
                raise
            await asyncio.sleep(2 ** attempt)
        except httpx.TransportError:
            if attempt == 3:
                raise
            await asyncio.sleep(2 ** attempt)
Schema validation happens before any GPU time is consumed. If the planner generates a malformed sub-task, the executor rejects it immediately. Executor calls retry up to 3x (1s, 2s, 4s backoff). Planner calls do not retry: if the planner fails, it is cheaper to re-plan than to retry a bad plan.
Redis Task Queue
The orchestrator pushes sub-tasks to Redis after receiving the plan:
import asyncio
import redis.asyncio as redis
import json

r = redis.Redis()

async def dispatch_plan(task_id: str, plan: dict):
    for step in plan["steps"]:
        # Push each sub-task to the task queue
        await r.rpush(f"tasks:{task_id}", json.dumps(step))
        # Initialize status tracking
        await r.hset(f"task:{task_id}:status", step["step_id"], "pending")

async def executor_worker(task_id: str):
    while True:
        # Blocking pop with 30s timeout
        result = await r.blpop(f"tasks:{task_id}", timeout=30)
        if result is None:
            break
        _, raw = result
        subtask = json.loads(raw)

        # Re-queue if dependencies are not yet complete
        deps = subtask.get("depends_on", [])
        if deps:
            statuses = await r.hgetall(f"task:{task_id}:status")
            failed_deps = [d for d in deps if statuses.get(str(d).encode()) == b"failed"]
            if failed_deps:
                await r.hset(f"task:{task_id}:status", subtask["step_id"], "failed")
                continue
            pending_deps = [
                d for d in deps
                if statuses.get(str(d).encode()) not in [b"complete", b"failed"]
            ]
            if pending_deps:
                await r.rpush(f"tasks:{task_id}", raw)
                await asyncio.sleep(0.5)
                continue

        # Mark as executing
        await r.hset(f"task:{task_id}:status", subtask["step_id"], "executing")

        try:
            output = await execute_subtask(subtask)
            await r.hset(f"task:{task_id}:results", subtask["step_id"], json.dumps(output))
            await r.hset(f"task:{task_id}:status", subtask["step_id"], "complete")
        except Exception:
            await r.hset(f"task:{task_id}:status", subtask["step_id"], "failed")

async def wait_for_completion(task_id: str, timeout: int = 300) -> bool:
    deadline = asyncio.get_event_loop().time() + timeout
    while asyncio.get_event_loop().time() < deadline:
        statuses = await r.hgetall(f"task:{task_id}:status")
        if statuses and all(v in [b"complete", b"failed"] for v in statuses.values()):
            return True
        await asyncio.sleep(0.5)
    return False
Failed steps after 3 retries move to a dead-letter queue. The orchestrator skips dependents of failed steps and flags them in the final response.
Observability and Per-Stage Cost Attribution
Link the planner and executor cost streams to your team's GPU cloud FinOps attribution model so each agent workload gets billed to the right cost center.
Per-stage token tracking:
from prometheus_client import Counter, Histogram

planner_tokens = Counter(
    "planner_token_total",
    "Tokens processed by the planner",
    ["stage"]  # "prompt" or "completion"
)
executor_tokens = Counter(
    "executor_token_total",
    "Tokens processed by executors",
    ["step_type"]
)
task_cost_histogram = Histogram(
    "task_cost_usd",
    "Estimated cost per task in USD",
    buckets=[0.001, 0.005, 0.01, 0.05, 0.1, 0.5]
)

def record_planner_call(usage: dict):
    planner_tokens.labels(stage="prompt").inc(usage["prompt_tokens"])
    planner_tokens.labels(stage="completion").inc(usage["completion_tokens"])

def record_executor_call(usage: dict, step_type: str):
    executor_tokens.labels(step_type=step_type).inc(
        usage["prompt_tokens"] + usage["completion_tokens"]
    )
Derive cost from token counts:
# H200 SXM5 at $4.54/hr, ~2,500 tok/sec at 70B FP8
H200_COST_PER_TOKEN = 4.54 / (2500 * 3600)

# L40S at $0.96/hr, ~6,000 tok/sec at 7B FP8
L40S_COST_PER_TOKEN = 0.96 / (6000 * 3600)

def estimate_task_cost(planner_usage: dict, executor_usages: list[dict]) -> float:
    planner_total = planner_usage["prompt_tokens"] + planner_usage["completion_tokens"]
    executor_total = sum(
        u["prompt_tokens"] + u["completion_tokens"]
        for u in executor_usages
    )
    return (planner_total * H200_COST_PER_TOKEN) + (executor_total * L40S_COST_PER_TOKEN)
Budget enforcement middleware:
Before dispatching a plan, estimate the executor cost and abort if it exceeds your per-task threshold:
AVG_EXECUTOR_TOKENS = 800  # tune from your workload profiling
PER_TASK_BUDGET = 0.01  # $0.01 per task

async def dispatch_with_budget_check(task_id: str, plan: dict):
    estimated_cost = len(plan["steps"]) * AVG_EXECUTOR_TOKENS * L40S_COST_PER_TOKEN
    if estimated_cost > PER_TASK_BUDGET:
        # Re-invoke planner with stricter constraint
        plan = await replan_with_constraint(
            task_id,
            max_subtasks=5,
            reason=f"Budget exceeded: {estimated_cost:.4f} > {PER_TASK_BUDGET}"
        )
        # Re-evaluate cost with the new plan; abort if still over budget
        estimated_cost = len(plan["steps"]) * AVG_EXECUTOR_TOKENS * L40S_COST_PER_TOKEN
        if estimated_cost > PER_TASK_BUDGET:
            raise HTTPException(
                status_code=429,
                detail=f"Re-planned cost {estimated_cost:.4f} still exceeds budget {PER_TASK_BUDGET}",
                headers={"Retry-After": "60"}
            )
    await dispatch_plan(task_id, plan)
If the second plan still exceeds budget, return an error to the caller with a Retry-After header. Track the subtask_count_histogram per task type. If p95 subtask count for a task type drifts above 2x the baseline from your initial profiling, trigger automatic re-plans with a stricter constraint and alert your team.
Production Checklist
- Tool-call schemas: define JSON Schema for every tool the executor can call and validate every planner output before dispatching to the executor pool.
- Retry semantics: executor sub-tasks retry up to 3x with exponential backoff; failed sub-tasks after 3 retries mark the step "failed" and the orchestrator skips its dependents gracefully.
- Planner caching: hash
sha256(task + model_version)and cache the plan in Redis with a 1-hour TTL; identical tasks hit cache and skip the H200 call entirely. - Max subtask limit: inject
max_subtasks: 8into the planner system prompt; monitor the histogram and tighten the constraint if p95 exceeds 8. - Independent autoscaling: planner pool scales on p95 TTFT; executor pool scales on Redis queue depth; never couple their scaling triggers.
- Dead-letter queue: move sub-tasks that fail all 3 retries to a DLQ; surface them in your monitoring dashboard so you can identify recurring executor failures by tool type.
- Model version pinning: pin vLLM model version and SGLang model version; planner JSON plan format changes between model versions and will break executor parsing.
Multi-tier agent cost optimization starts with matching each stage to the right GPU. The planner needs frontier-model throughput for complex task decomposition; the executor pool needs volume at the lowest cost per sub-task.
H200 on Spheron → | L40S executor instances → | View all pricing →
Quick Setup Guide
Choose the planner model based on your task's reasoning complexity. For multi-hop research or code-generation tasks, Llama-3.3-70B-Instruct or Qwen2.5-72B-Instruct on H200 covers the planner tier. For executor tasks (tool calls, data fetching, simple transforms), Qwen2.5-7B-Instruct or Qwen2.5-14B-Instruct on L40S handles 95%+ of sub-tasks reliably. Run 200 representative tasks through your frontier model and measure: how many sub-tasks it generates on average, which sub-task categories require model capability (route to a larger executor) vs which are routine (route to the 7B). That profiling shapes your executor tier split.
Rent an H200 SXM5 node on Spheron. Deploy vLLM: 'vllm serve meta-llama/Llama-3.3-70B-Instruct --dtype fp8 --port 8001 --tool-call-parser llama3_json --max-num-seqs 64 --max-model-len 8192'. The --tool-call-parser flag tells vLLM to decode JSON tool calls from the model's output. Set --max-num-seqs to match your expected concurrent planning requests. This instance runs only the planner model and handles no executor traffic.
Rent two or more L40S nodes on Spheron. Deploy SGLang on each: 'python -m sglang.launch_server --model-path Qwen/Qwen2.5-7B-Instruct --tp 1 --port 8002 --mem-fraction-static 0.85'. Each L40S node can serve 30-50 concurrent sub-task requests at this model size. Scale the number of nodes horizontally based on queue depth. Use spot pricing for executor nodes since sub-task failures retry automatically.
Deploy a FastAPI proxy that exposes two routes: POST /plan (forwards to vLLM on H200, returns JSON plan) and POST /execute (validates tool-call schema, then forwards to SGLang on L40S). Between them, push decomposed sub-tasks to a Redis list. Executor workers pop tasks from Redis and POST to the SGLang endpoint. Track task status in Redis hashes: pending, executing, complete, failed. The orchestrator waits for all sub-tasks to reach complete or failed before assembling the final response.
After each /plan call, read prompt_tokens and completion_tokens from the vLLM response. Multiply by H200 on-demand cost-per-token (hourly rate / tokens-per-hour at that model). After each /execute call, do the same for the L40S cost. Store per-task planner_cost and executor_cost_total in Redis. Before dispatching a plan, estimate executor cost as subtask_count * avg_executor_tokens * L40S_cost_per_token. If the estimate exceeds the per-task budget threshold, re-plan with a stricter max_subtasks constraint. Alert via Prometheus if per-task cost drifts > 20% above baseline.
Planner pool: scale on p95 TTFT. If p95 TTFT exceeds 2 seconds, add another H200 node. Executor pool: scale on Redis queue depth. If queue depth exceeds 100 pending tasks, provision an additional L40S node via the Spheron API. Scale in when queue has been empty for 10 minutes. The two tiers should scale completely independently since planner saturation and executor saturation have different root causes. For the executor pool, set a minimum floor of one warm node to avoid cold-start delays on the first tasks after idle periods.
Frequently Asked Questions
Plan-and-Execute is a two-stage agent architecture where a frontier planner LLM (run once per task) decomposes a user request into a structured JSON plan of atomic sub-tasks, and a pool of smaller executor LLMs carries out each sub-task independently. The planner handles reasoning and decomposition; the executors handle tool calls and data retrieval. This separation lets you pay frontier model prices only for the planning step instead of every agent step.
A ReAct loop calls the same large model for every thought-action-observation step. For a 10-step task, that is 10 frontier model calls. Plan-and-Execute makes 1 frontier model call (the plan) and then routes each of the 10 executor steps to a small model. If the executor model costs 10-15x less per token than the planner, and executor calls make up 90% of total token volume, the weighted average cost drops 80-90% compared to a pure ReAct loop.
Use H200 SXM5 or B200 for the planner pool. The planner runs a large frontier model (70B-72B) and needs high HBM bandwidth for fast TTFT on complex reasoning tasks. Use L40S for the executor pool. The executor runs 7B-14B models, and L40S at its on-demand price delivers the best throughput-per-dollar for that model size. Run executor instances on spot pricing where possible since sub-task failures are retried and spot preemption is acceptable.
A lightweight FastAPI proxy sits in front of both GPU pools. It reads the request path: POST /plan goes to the planner pool (vLLM on H200), POST /execute goes to the executor pool (SGLang on L40S). The orchestrator layer sends the user task to /plan, receives the JSON plan, and then fans out one POST /execute per sub-task. The router validates executor requests against the tool-call JSON schema before forwarding, rejecting malformed plans before they consume GPU time.
Set an explicit max_subtasks constraint in the planner system prompt (e.g., 'Decompose into at most 8 sub-tasks'). Track the subtask count histogram in Prometheus. If the p95 subtask count drifts above your expected ceiling (a sign the planner is over-splitting), trigger a re-plan with a stricter constraint injected into the prompt. Also implement a budget guard: estimate the executor cost for the generated plan before dispatching and abort if it exceeds a per-task threshold.